Allianz - Moving Average Case Study
Posted on 2016-07-02 by myTrades
Buying when an uptrend starts and selling when it ends is the dream of every trader. The billion dollar question is: when does the trend change actually happen? Hindsight is the best teacher, as they say, so we'll analyse the past year. Let's take a look at how the 30-day moving average (MA 30) works as an indicator in real life.
Buying when an uptrend starts and selling when it ends is the dream of every trader. The billion dollar question is: when does the trend change actually happen? Hindsight is the best teacher, as they say, so we'll analyse the past year. Let's take a look at how the 30-day moving average (MA 30) works as an indicator in real life. In the centre of our case study will be Allianz (ALV.F), a financial institution whose stock is a component of the German stock index (DAX).
The strategy is a simple one:
-
only enter long positions,
-
buy when the price crosses a downward MA 30 from below and
-
sell when the price crosses an upward MA 30 from above.
 |
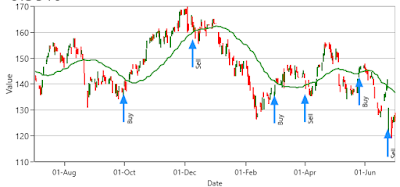
| Allianz 1 year chart with 30-day moving average |
On this 1-year chart you can see that the price has decreased since last July, so simply buying and keeping the stocks would have meant a loss of 10,52%. Although taking a short position would have been profitable, without a strategy, both deals are just about waiting and hoping. However, it's really exciting to observe the blue arrows. They indicate points for buying and selling based on the strategy outlined above.
There were 3 completed deals in this period of time. Let's take a closer look at each of them:
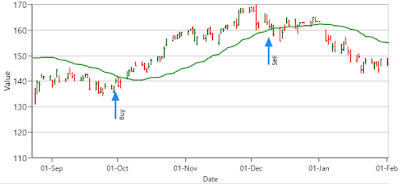
The first suggested entry point was on 30th September 2015 with an exit on 9th December 2015.
 |
| Allianz chart 30-day moving average deal1 |
As you can see on the chart, the timing was quite good, resulting in a profit of 15,04%.
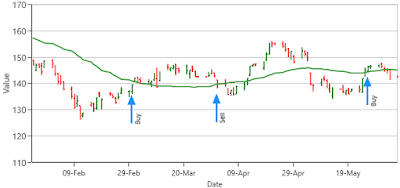
The outcome of the next deal (1st March - 1st April 2015) was still somewhat positive with +0.32% but obviously far from optimal.
 |
| Allianz chart 30-day moving average deal2 |
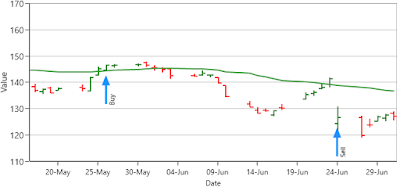
The last deal (26th May - 24th June) was a complete disaster, losing 13.57%. If the exit date or the pattern in the chart looks familiar, it's not by chance: that was the day when the UK's EU referendum results were announced. Although Allianz is not a British bank, the European financial sector suffered from the Brexit news, too. Just look at the gap between the bars!
 |
| Allianz chart 30-day moving average deal3 |
Watching the chart, you might be asking the question: why didn't the strategy sell stocks early June? The price clearly crosses the MA 30 from above. The trick is, it's a slightly downward trend so it doesn't fit in our strategy. If the stocks were sold, however, a new position would have been opened on 23rd June with an exit point somewhere in the future. We don't know yet if that's good news or bad.
All that said, let's see how a hypothetical person's investments change over time:
They had €10,000 in cash a year ago and blindly followed the strategy, automatically taking every trade recommended. When buying, they always bought as many shares as they could afford and always sold everything when a sell signal came. After a healthy profit of 15.35%, they suffered a big loss, ending up with 0.17% less money than they had started with. Was it a bad strategy? Well, it depends on your point of view. It still outperformed the stock itself but of course, the yield is negative.
They had €10,000 in cash a year ago and blindly followed the strategy, automatically taking every trade recommended. When buying, they always bought as many shares as they could afford and always sold everything when a sell signal came. After a healthy profit of 15.35%, they suffered a big loss, ending up with 0.17% less money than they had started with. Was it a bad strategy? Well, it depends on your point of view. It still outperformed the stock itself but of course, the yield is negative.
Some risks can be avoided by fine-tuning the strategy, using more indicators or even different kinds of strategies for entry and exit. Around events that can shock the market, it's sometimes the wisest not to trade at all.
